Happy to Help

Trusted by Clients Across Categories

Few of our prestigious clients

Data that makes sense and helps you in moving ahead


Google Analytics provides some great preconfigured reports to work out of the box. However, the ability to customize and build your own reports from scratch is what gives the scope of valuable insights.

A good analytics tool and data invariably has the following characteristics:

  • Easy to Use:
    Instantly create advanced data visualizations with just a few clicks. All within a consumer-grade interface.
  • Interactive Visualizations:
    Accelerate data discovery. Drill down, highlight, and filter your data on the fly.
  • Self-service Insights:
    Create, customize, and share rich visual dashboards. Access anywhere, anytime with just a web browser.
  • Dashboards:
    We design and develop visual displays of metrics, measures and benchmarks that are apt for your business. Through different techniques of visualizing your data, these dashboards can help you detect problems, understand performance and improve business outcomes and quality.
  • Data Collection and Integration:
    We collect and integrate project data into the Enterprise Data Warehouse.
  • Business Intelligence Reporting:
    We work closely with our customers to produce data-driven reports that answer the "who, what, when, where, why". Our interactive and parameterized solutions can identify retrospective trends, make comparisons, and formulate subsequent questions. Customers may also specify customized data extractions that can be used for further analysis.
  • Reports for Measuring Site Performance & Acquisition Patterns
    • Browser Report
    • Visitor Acquisition Efficiency Analysis Report
    • Customer Behaviour Report
    • Mobile Performance Report
    • Site Diagnostics: Page Timing Report
    • Hours & Days Report
    • Referring Sites Report
    • Content Efficiency Report
    • Traffic Acquisition from Social Media Report
  • Reports for Measuring Site Performance & Acquisition Patterns
    • SEO: Referring Pages Report
    • SEO Insights for Google Organic (not provided) Report
    • Keyword Analysis Report
  • Reports for Measuring Site Performance & Acquisition Patterns
    • Metrics by Day of Week Name & Time of Day
    • Visitor Acquisition Efficiency Analysis Report
    • Long-Tail Converters

Google Analytics is the tool that tells
you whether your efforts are actually translating into results.
Mobile Performance Report

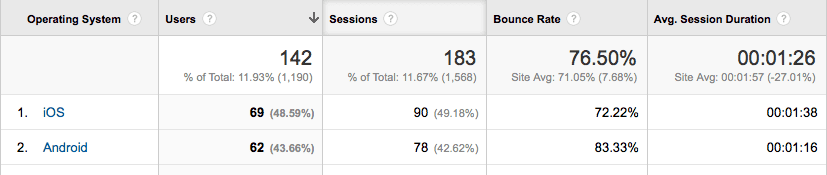
In fact, mobile is so important now that Google even penalizes websites that are not mobile-friendly. For marketers, knowing how their sites perform on smaller screens is vital to staying alive in the SERPs and winning over customers. The mobile performance report shows you how well your site (not app) is optimized for mobile and where you need to make improvements.


Traffic Acquisition Report

  • The traffic acquisition report will tell you all this and more.
  • This will give you a quick breakdown of your traffic sources.


Traffic Acquisition Report

Content Efficiency Report

This report tracks entrances, page-views, bounces and goal completions to help you answer questions like:

  • Which is the most engaging content for your audience?
  • Which content converts leads?
  • Which content is shared most by your users?

Keyword Analysis Report

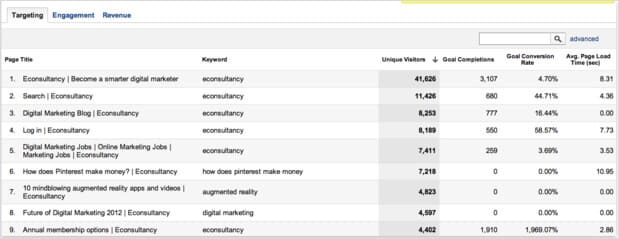
We use this data to figure out what keywords are working best for you.


New vs. Returning Visitors

Usually, the metrics for new and returning visitors are different. Returning visitors tend to spend longer and have lower bounce rates.


Landing Pages Report

This report will tell you which of your landing pages are most efficient.


Bounce Rate vs. Exit Rate Report

“Bounce Rate” is the percentage of visitors who don’t take any action and leave from the same page they landed on.

“Exit Rate” measures the percentage of your visitors who browse more than one page on your site before leaving.

A comparison of these reports helps:

  • Develop custom marketing dashboard concepts
  • Reporting on key metrics
  • Analysing the effect of different online and offline channels on each other and developing and implementing innovative strategies for improvement and growth
  • Analysing online user behaviour
  • Performing ROI analysis to evaluate efficiency and effectiveness of different marketing campaigns

Our Focus:

  • Delivering regular reporting and analysis documentation to you and presenting findings or test results in person or via conference calls.
  • Representing AdvelGroup team in meetings and pitch presentations
  • Assisting in educating the benefits of digital marketing and the importance of online measurement & performance optimisation

Trusted by 6000+ Clients Across 36 Countries

Few of our prestigious partners